My RolE
- User flows & wireframing
- Journey mapping workshop
- UI/UX design
- Prototyping
THE problem
With more and more customers working from home, there was a spike in customers contacting BT, their wifi was down or underperforming. We got this data from contact centres. After a quick look at Adobe Analytics, I noticed that there is no clear journey to fix the broadband issue, users kept getting stuck in a loop after reading multiple articles. Moreover, a lot of articles were out of date.
As a BT Broadband customer, I need a quick solution to my problem, so I can resume the services, I am paying for.
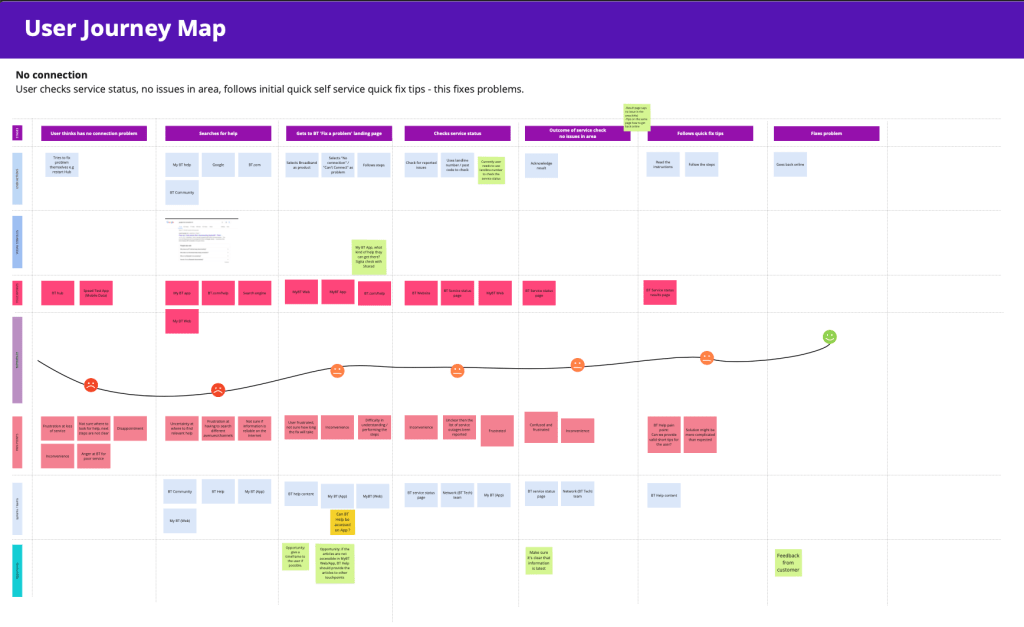
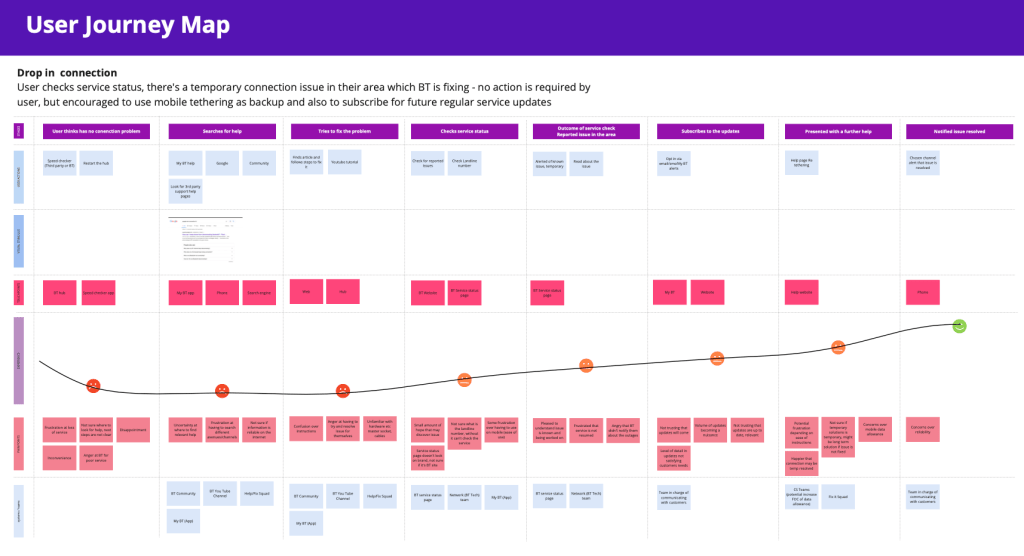
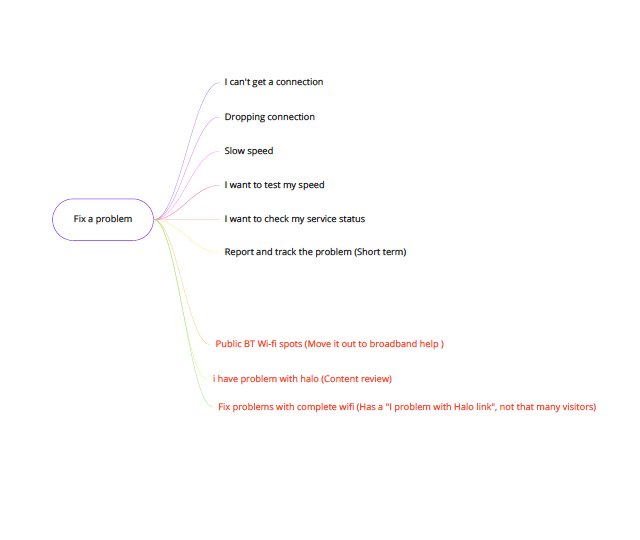
UnDERSTANDING THE PROBLEM AND JOURNEY MAPPING
Three main issues customers are experiencing: No connection, Dropping connection and Slow speed.
To get a better picture, I looked at the data in Adobe Analytics and heatmaps in Decibel.
Data showed that users get stuck in a loop reading help articles.
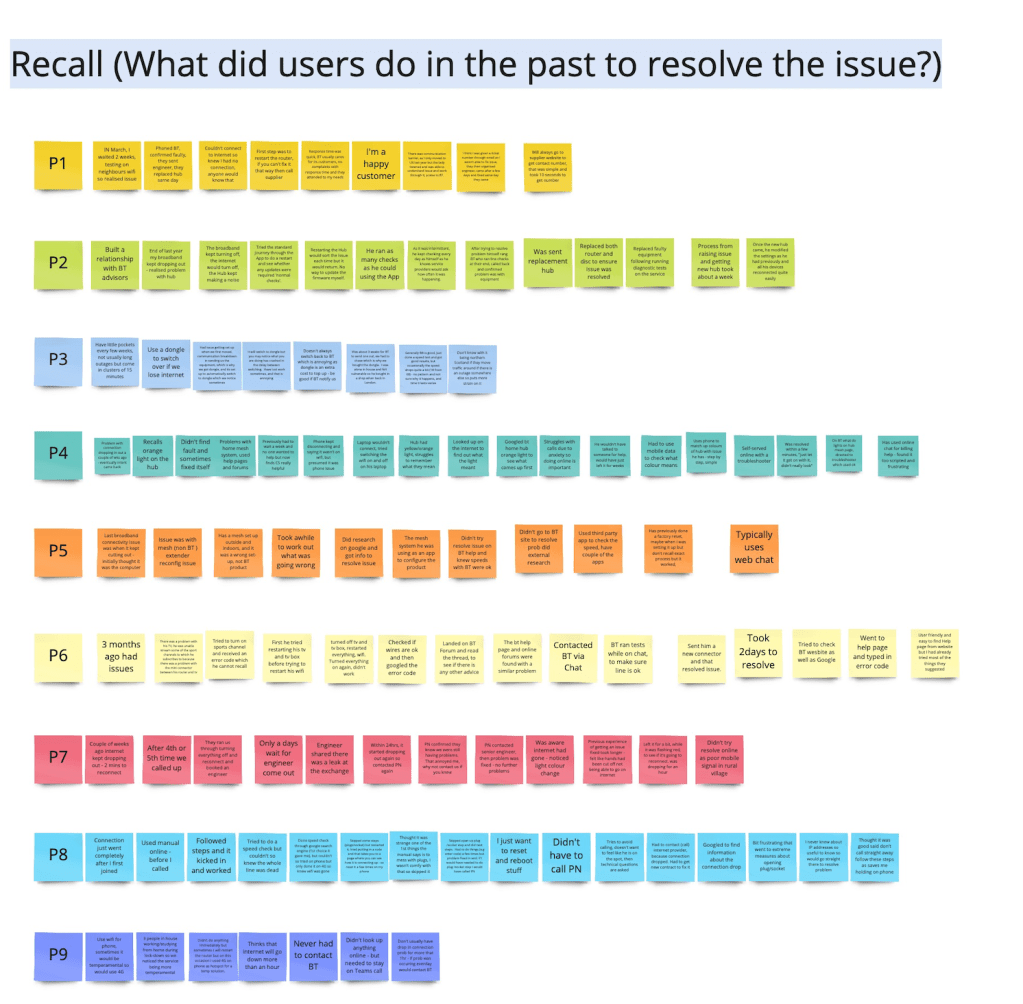
Then, I facilitated a two day Journey mapping session with a squad. Based on data we mapped a current journeys, as well as, mapped an ideal journey.
Research
We decided to interview 10 BT customers to understand their past experiences. We also decided to give participants tasks to complete on the live site.
Couple questions we were looking for an answer for:
- What do customers expect from our service aside from online help?
- How long do customers expect to spend online to resolve the issue before they drop off?
- Can customers fully resolve their issue online?
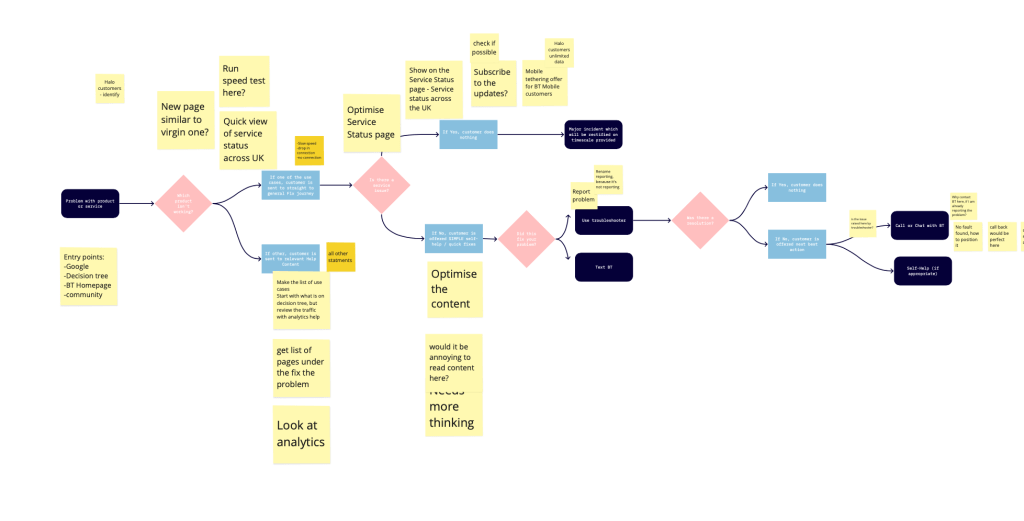
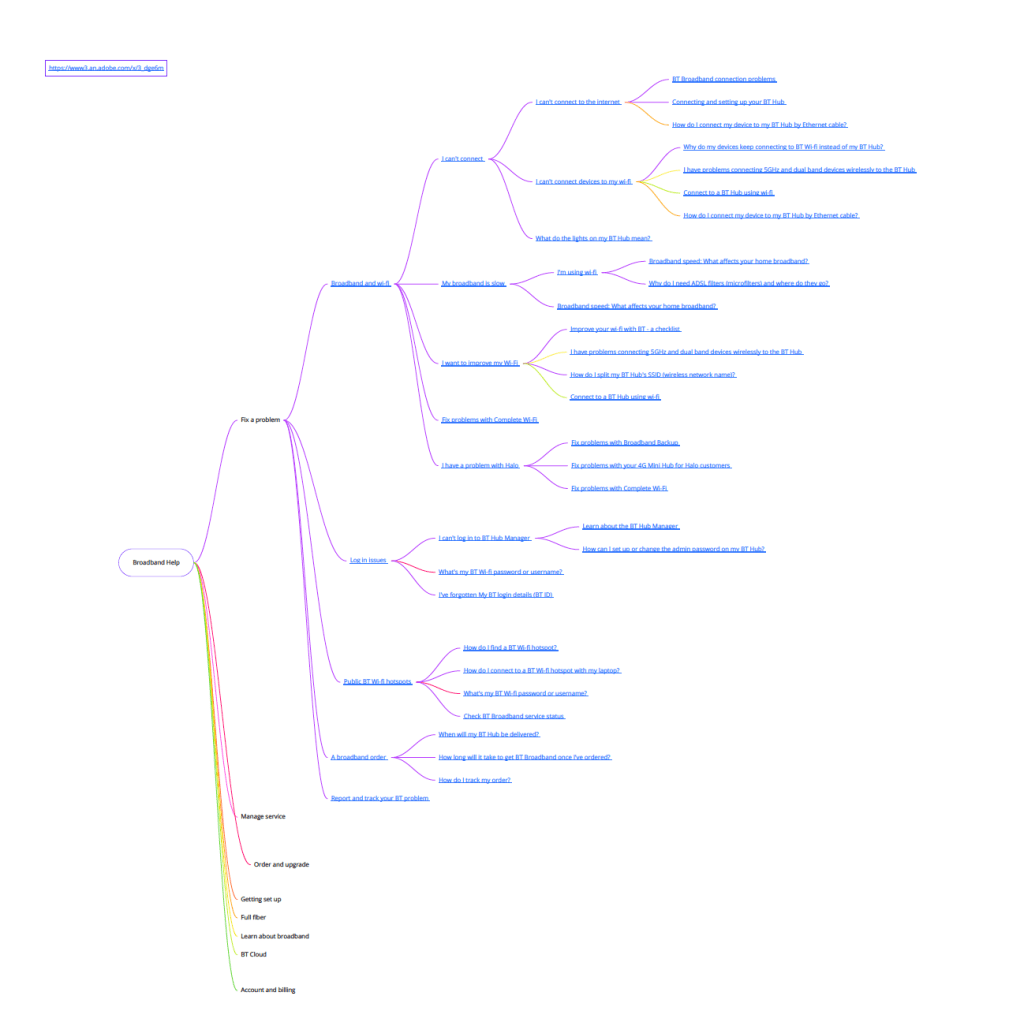
Entree Points
I started mapping entree points to the journey.
Analytics showed that most customers landed on the page from google, but about 30% used decision tree on the help site.
I decided to optimise it, no point on fixing the journey, if customers can’t get to it.
Design
Journey I started working on first was “No connection”- it means loss of connection. This can be due to several issues, I worked with stakeholders to understand technical part of it.
Then there is a broadband issue, users access the page on a mobile phone, via data, so design had to be mobile first. Instead asking user to read multiple articles, I took a journey approach.
I tested this new journey and prototype in a Usability testing session.
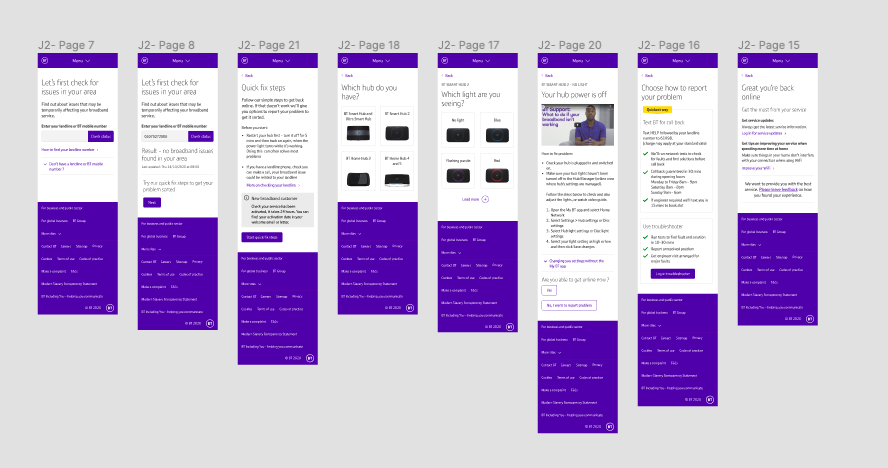
Step 1
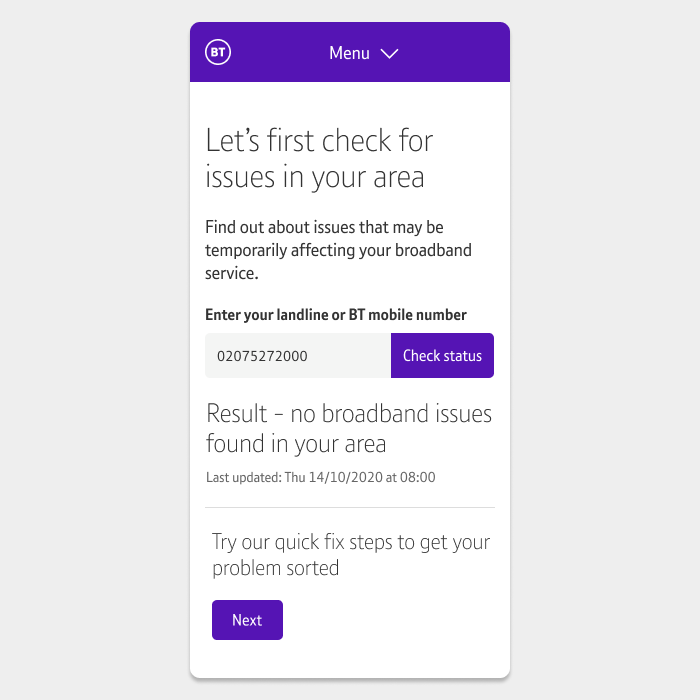
After working with stakeholders, I became clear that first step in the journey should be checking the broadband status in the area.
If broadband services down to weather conditions, giving user tips to fix it, won’t help.
If after checking the area there is no issue found, user is encouraged to use self-help steps.
Usability testing
Users understood this page and had no problem using it.
Step 2
For different types of customers, different quick solutions can work to fix the problem.
I decided to show that information upfront and then, if they still have problems take them to more complex solutions.
Usability testing
users mentioned that this information was useful and they learned new information.

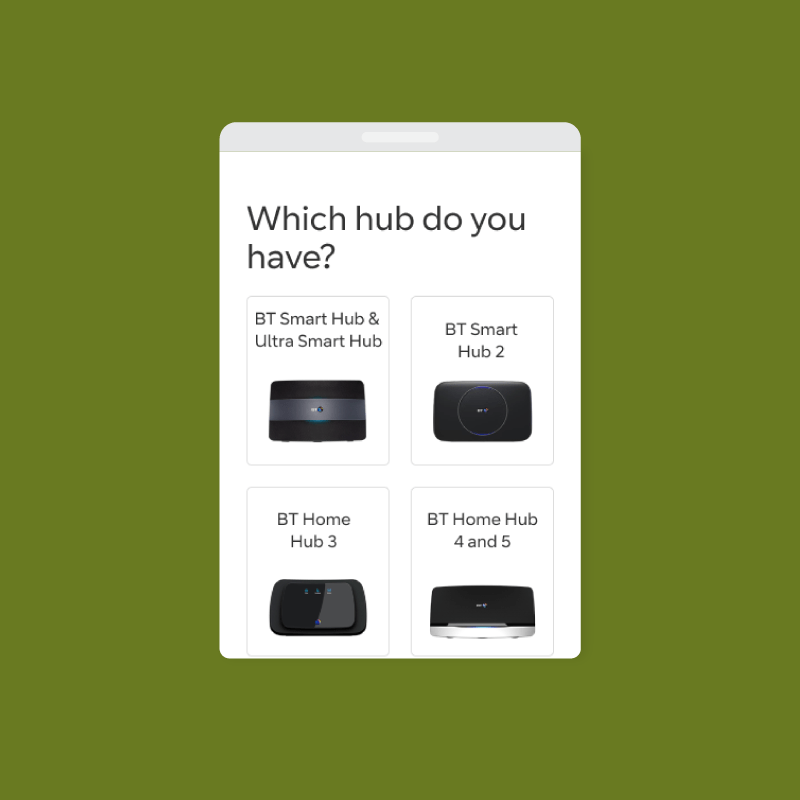
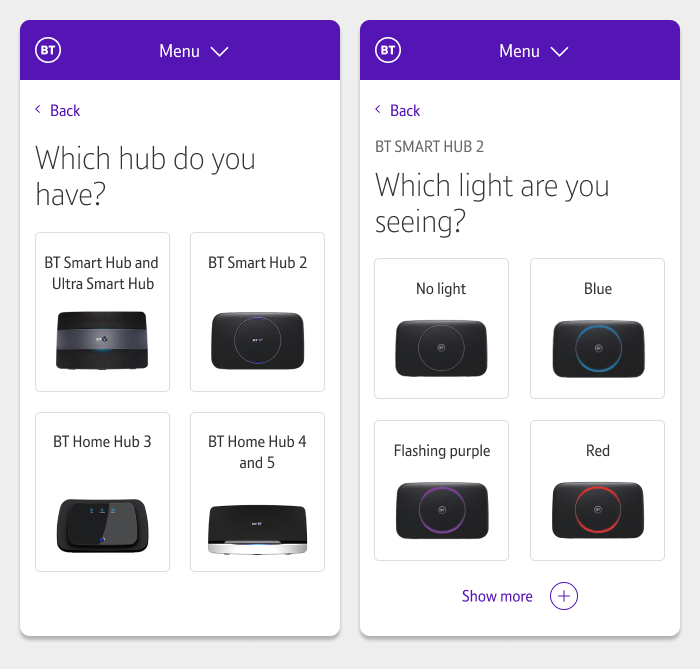
Step 3 & 4
Currently customer will need to self identify which router they have at home and what colour it’s showing.
Usability testing
Users seem to expect it and moved quickly through the journey.
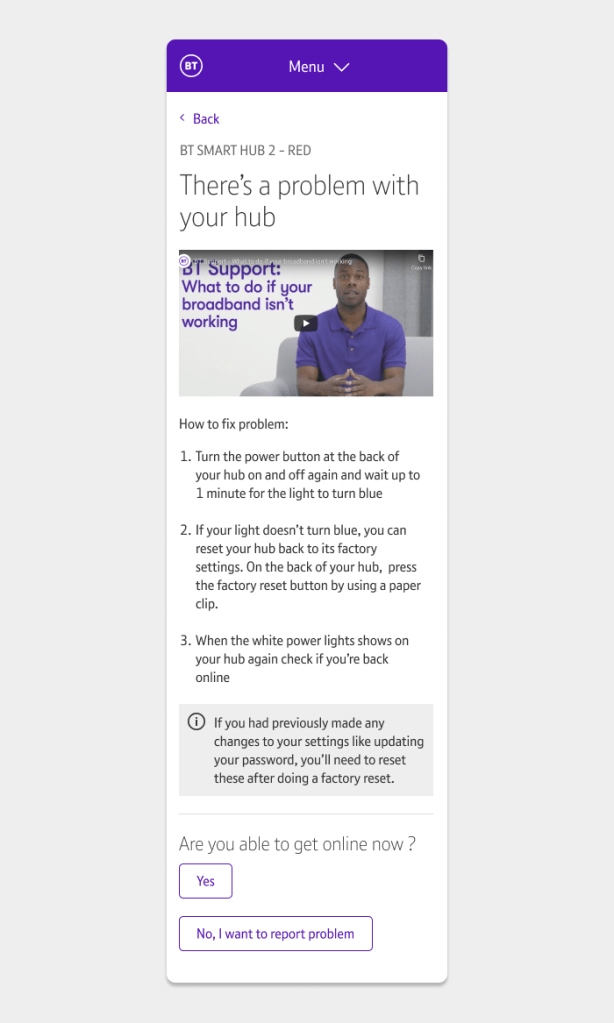
Step 5
After user identify the colour they seeing, they will be shown best course of action.
Content designer worked wit stakeholders to make sure the information is accurate and up to date. We agreed that only simple fix should be shown and if solution requires a lot of tech knowledge we would let users report it.
I worked on the prioritisation of the information on the page and simple article layout.
At the end of the page I decided to test new feature “Still need more help?” to see if users engage with it.
Usability testing
Users appreciated the video on the page, most of them said, they would watch it first before reading the steps. That’s due to their habits and preferring visual information.
They also mentioned, that if the broadband was fixed, they would drop out at this point.
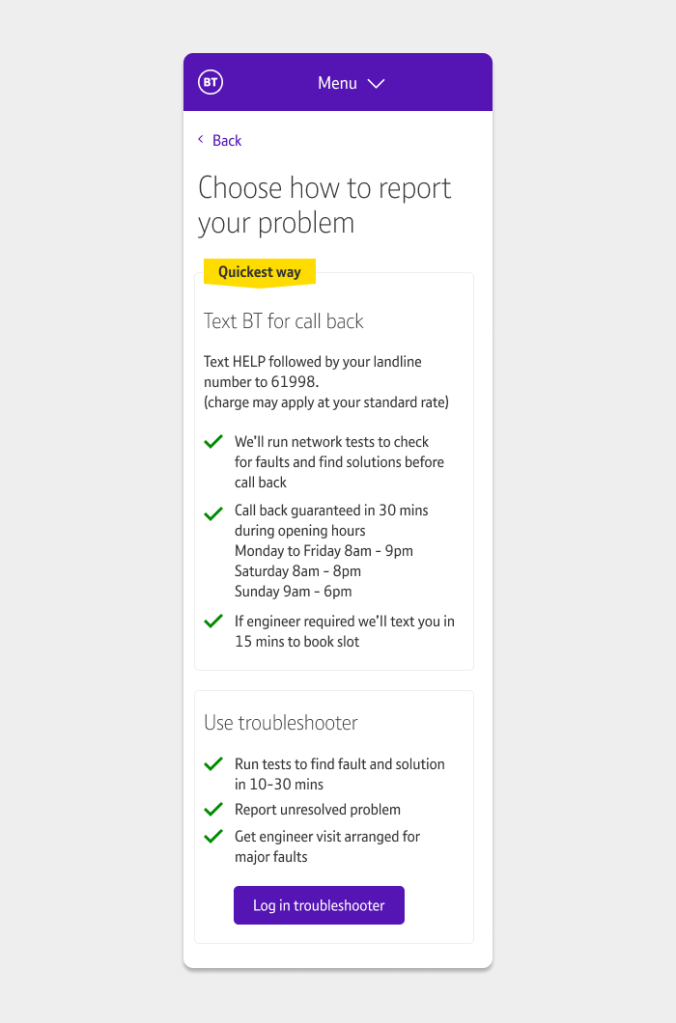
Step 6
At the end of the journey we gave customers option to report the problem. If it’s haven’t been fixed using the self-help steps.
Usability testing
Users find it helpful and mentioned that they like the Quickest way indicator.
Results
The prototype performed well in the usability test, in the lab. I was keen to test in real life, so we launches an a/b test.
A/B test performed well, with this new journey increasing customer satisfaction rate by 5%, so now it’s a current live journey to fix the broadband.
